Hello everyone!
I’m looking for people interested in Networks and Data Visualization for ‘reading’ the interconnections and general dynamics of the different active agents related to Holochain in the Social Networks.
I’ve been working on Social Networks Analysis (SNA) for a while, and I think it could be a very interesting point of view for getting valuable insights to the group.
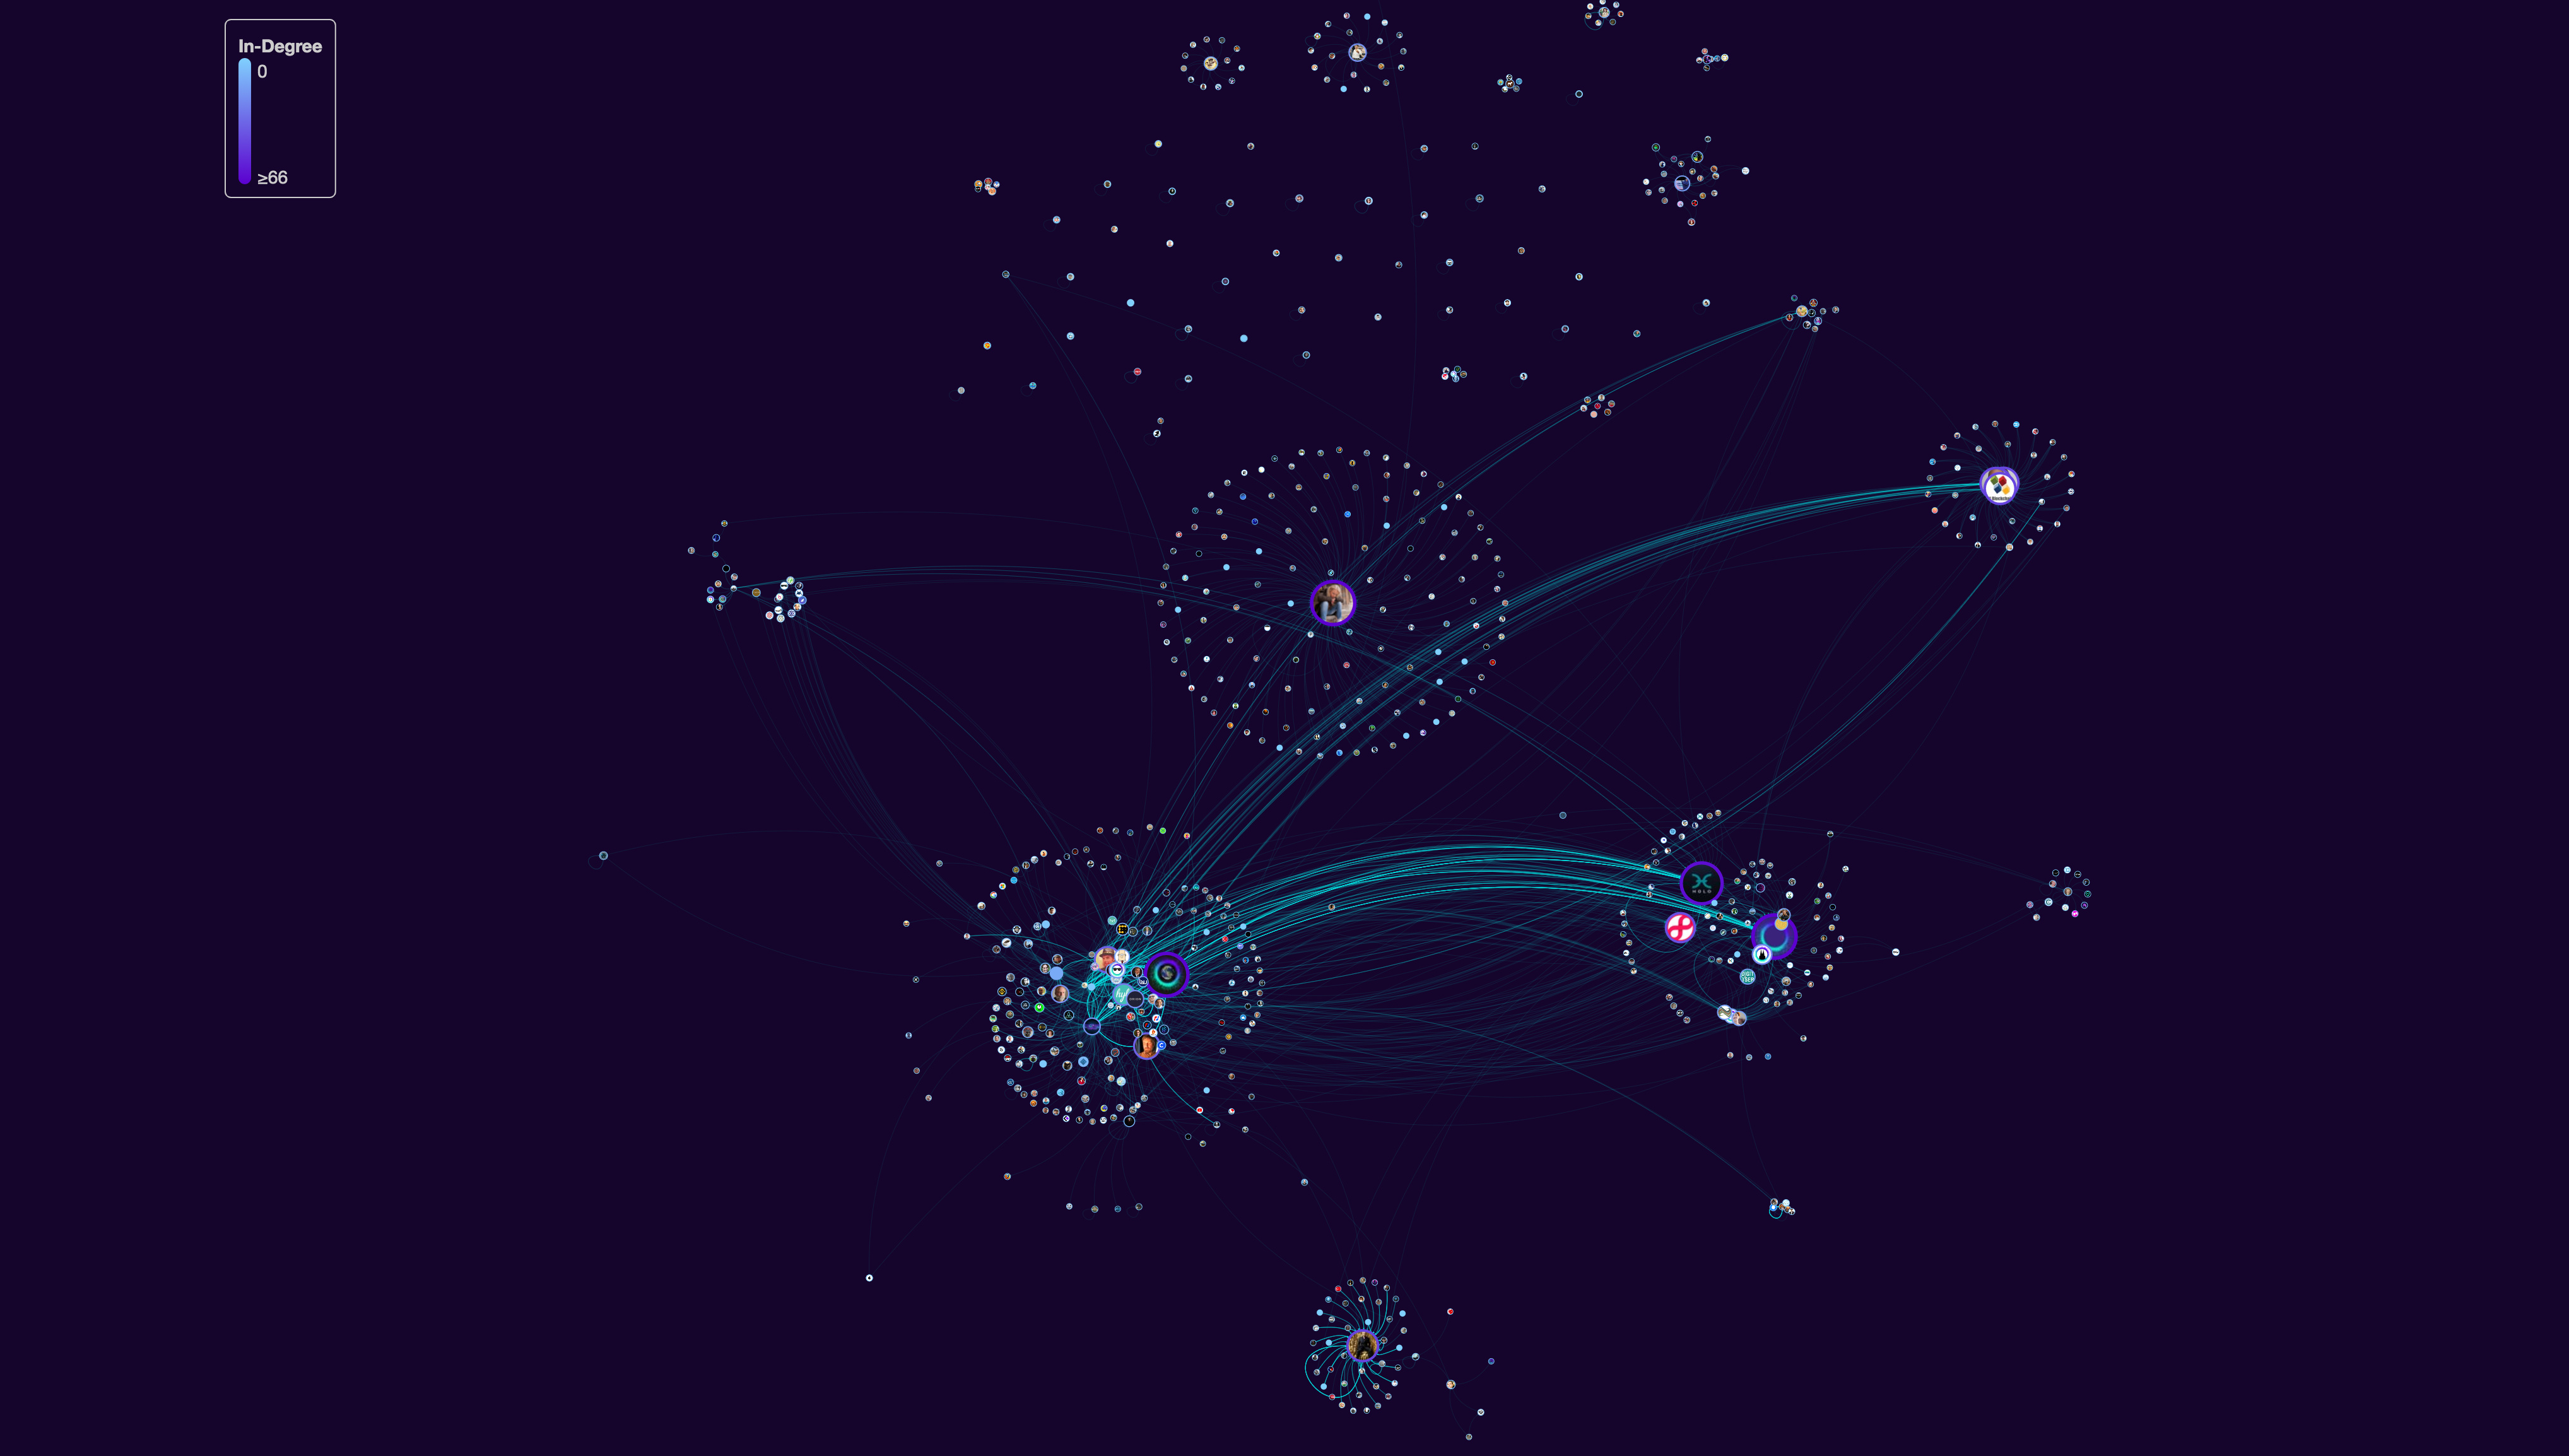
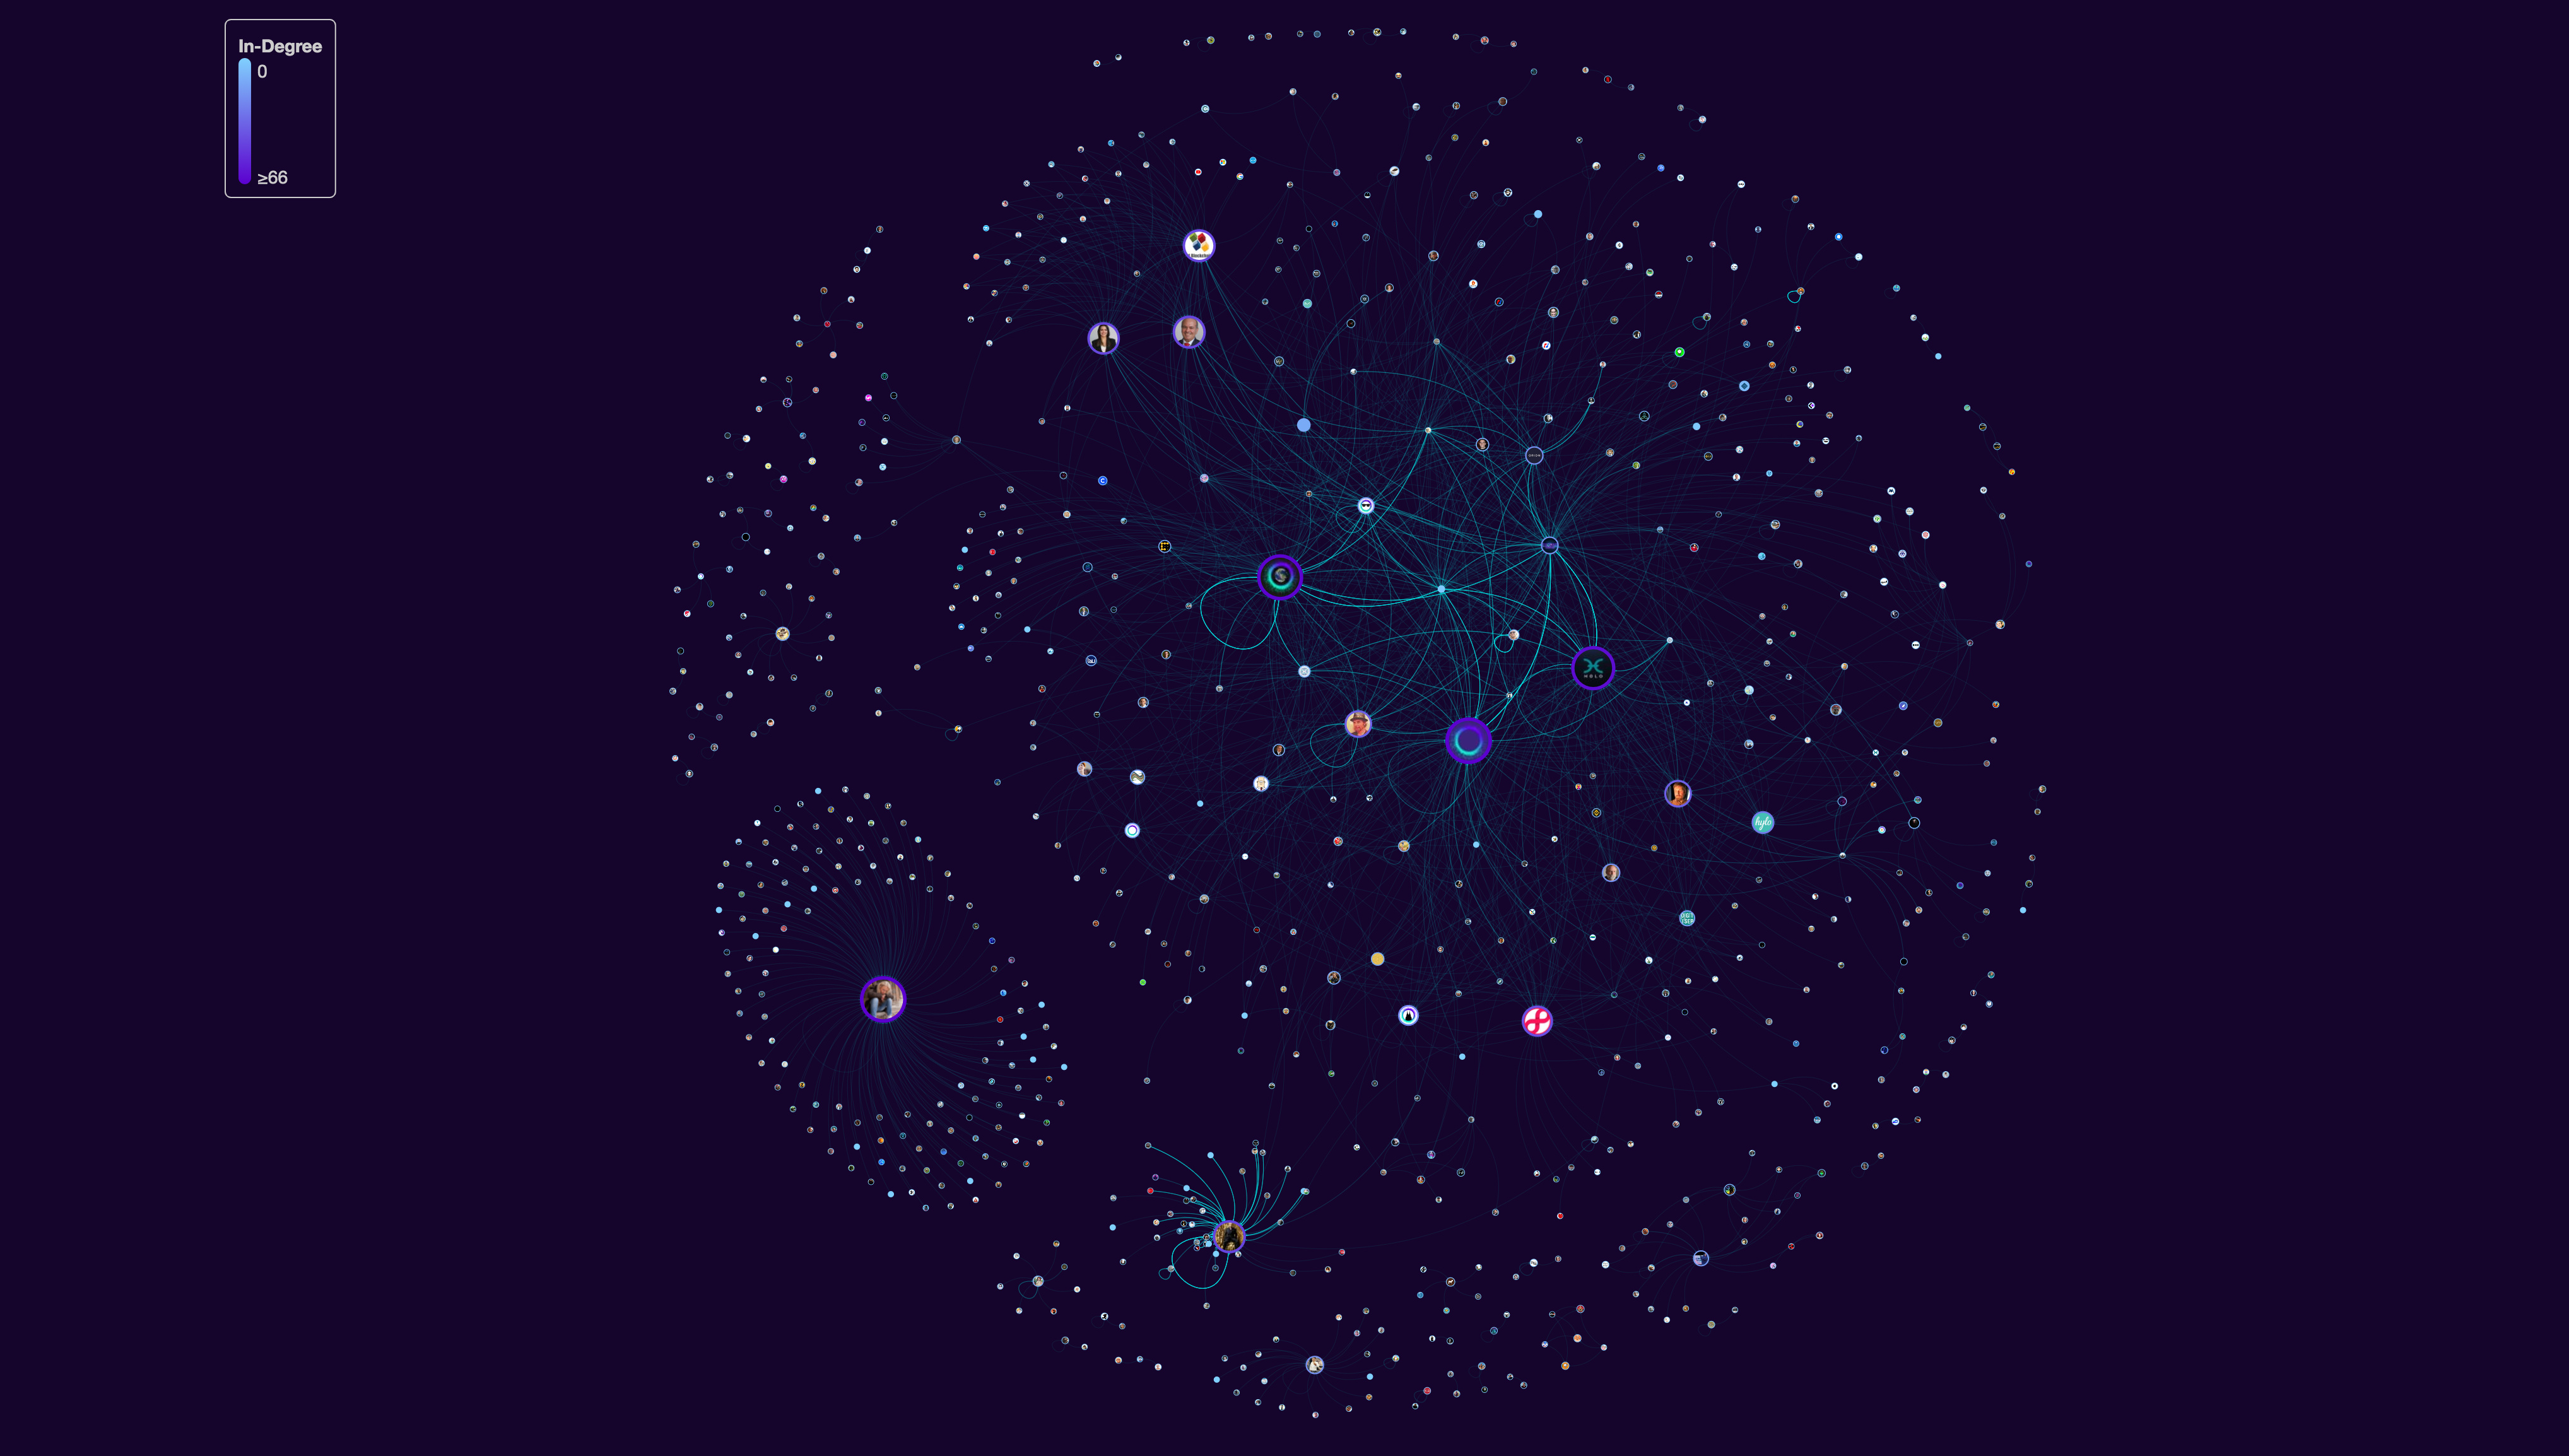
This time I’m sharing a Twitter based visualization related to the following hashtags:
‘Holochain OR Holofuel OR Holoports OR Holo’ and it covers a period of 8 days, from Sunday, 08 March to Monday, 16 March 2020.
Please be patient, it can take some time loading it the first time, and yes, as all tools, there is a learning curve in order to get a full understanding of what you’re seeing on the screen, but I think the platform is pretty intuitive 
You can read more on the description pane in the right side of the screen.
And I’ll be here, trying to give my best answers and looking forward to discuss the results and possibilities.
If you’re reading this and you think somebody could be interested on it, please call it to the conversation!
A preview: