
Would be worth having a way to display the state of the conductor on the UI.
Oh, now that’s an interesting request. The UI can hook into the conductor to do things like install DNAs, create agents, instantiate DNAs, open up RPC sockets, etc. And I know Holoscape can give you all that debug info but I don’t know how it’s getting it from the conductor. @lucksus if you have the time could you point Marcus in the right direction?
Hey @marcus
Paul was right that Holoscape taps into debugging info coming from the conductor.
It does actually do that VIA hc-web-client. Here’s the code:
So the basics are that the connect call Promise, resolves with a function called onSignal. You can hook into onSignal to subscribe to signals coming in from the conductor. By setting admin = true in the conductor config file, the conductor will be sending ‘instancestats’ signals, live updating the client with exactly the info you’re asking about 
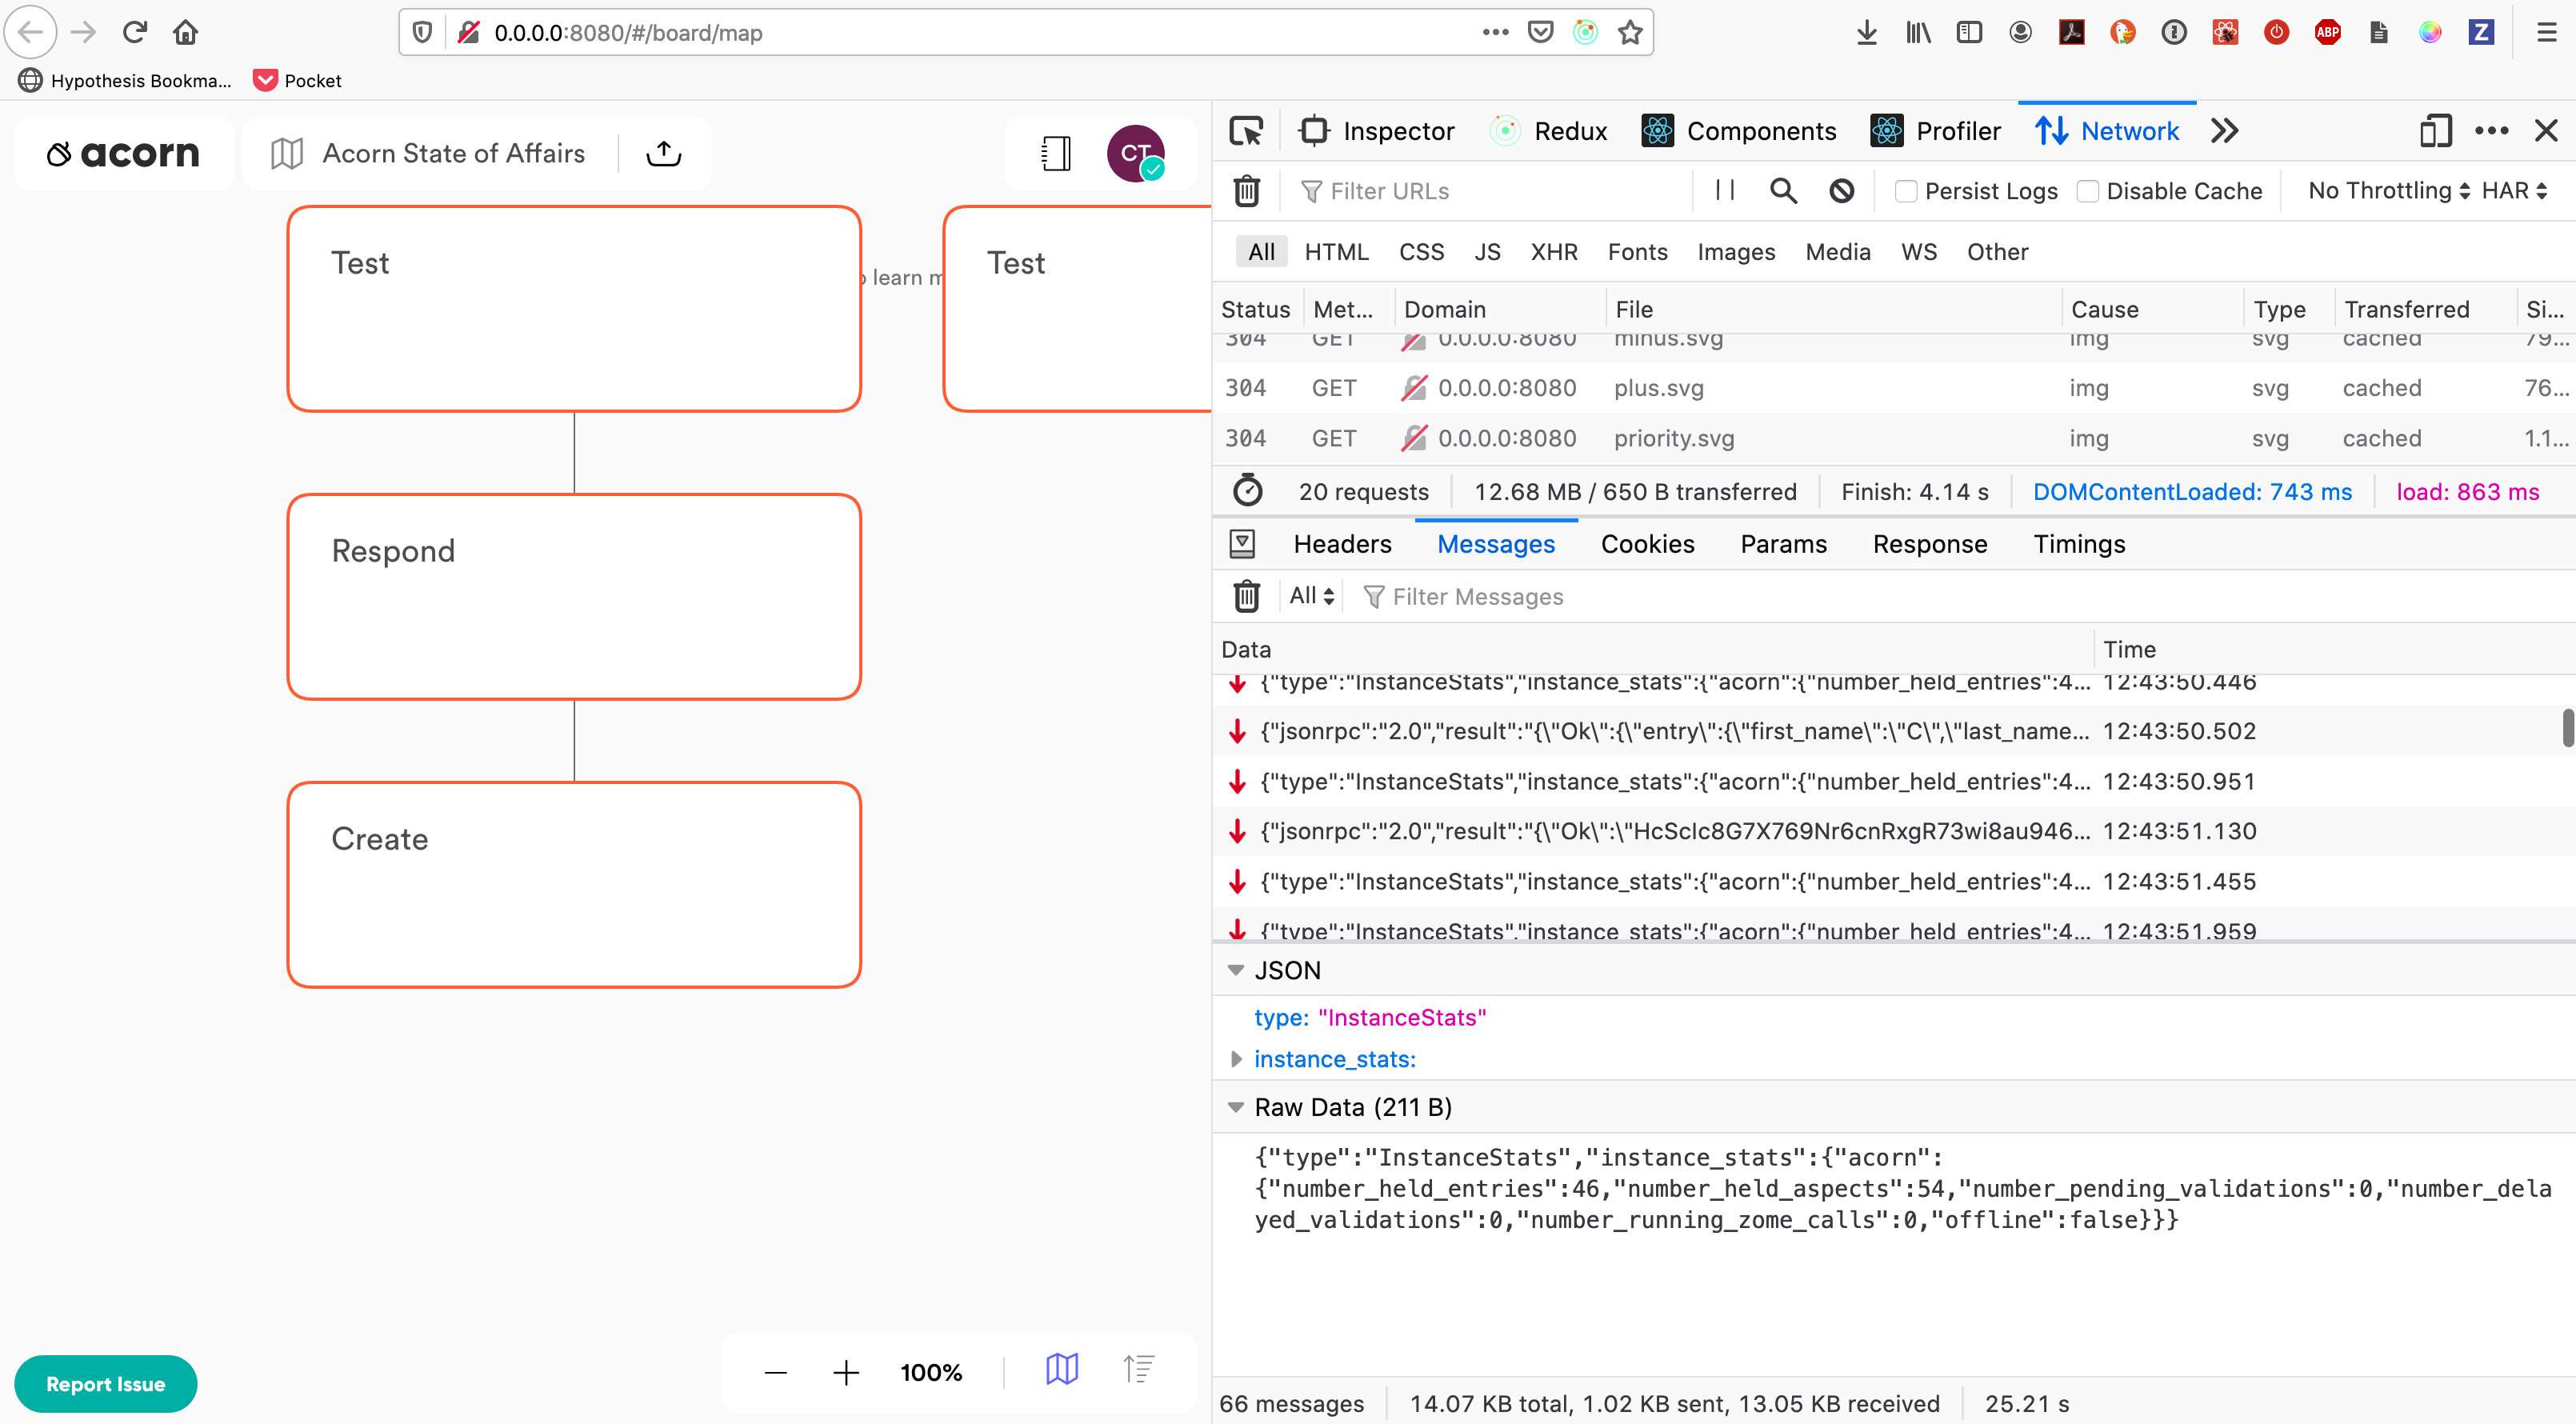
An InstanceStats signal looks like this:
{
  "type": "InstanceStats",
  "instance_stats": {
    "acorn": {
      "number_held_entries": 46,
      "number_held_aspects": 54,
      "number_pending_validations": 0,
      "number_delayed_validations": 0,
      "number_running_zome_calls": 0,
      "offline": false
    }
  }
}
I discovered this debug info flowing as well using the websocket messages panel of the Firefox dev tools
2 Likes
Awesome, thanks @Connoropolous! Keen to see what things will be added to InstanceStats in the future
1 Like
Hey @marcus yeah I realized that your original question asked about certain things that InstanceStats don’t really offer much insight into directly, though these two
"number_pending_validations": 0,
      "number_delayed_validations": 0,
could be used to calculate the numbers per second, since signals with this data is sent at a regular, short interval tick.
Anyways, the one that you’d have to dig into and contextualize a little bit more is ‘number of connected nodes’. That could mean a lot of different things. One of my guesses for interpreting it is to answer the question, how many nodes are online right now. Versus how many nodes have joined in total, which could also be interesting.
One way to test who’s online right now, that I used to employ waaay back in the Go version of Holochain, was to ping each registered agent at an interval, and see if you get a response. That’s a “peer-to-peer” way of checking. See https://github.com/holochain/PeerVis
The other way that’s possible right now, while sim2h is in use, is you can query the sim2h server…
Here’s something about that that I’ve learned:
To check the status of the sim2h server:
nix-shell https://github.com/holochain/holonix/archive/v0.0.67.tar.gz --run 'hc sim2h-client --message status --url ws://sim2h.harris-braun.com:9044/'
(reminder: v0.0.67 of holonix = v0.0.44-alpha3 of holochain)
nix-shell https://github.com/holochain/holonix/archive/v0.0.67.tar.gz --run 'hc sim2h-client --message ping --url ws://sim2h.harris-braun.com:9044/'
types you can use for --message param: ping , status , debug
debug offers a file dump of current sim2h entry aspect stuff